Data profiling and quality
Examine completeness, consistency, formatting, and terminology. Record issues, decisions, and transformations rather than silently changing the source data.

Help scientific and regulatory teams prepare, examine, and communicate data with rigor and context.
We bring a thoughtful, multidisciplinary approach to the needs of public-sector teams and the people they serve.
Assess completeness and consistency, resolve formatting issues, and document preparation steps.
Support the use and harmonization of relevant study data and health information standards.
Develop reproducible analyses, tables, listings, and visualizations to address reviewer questions.
Communicate patterns, limitations, and findings in formats suited to the audience.
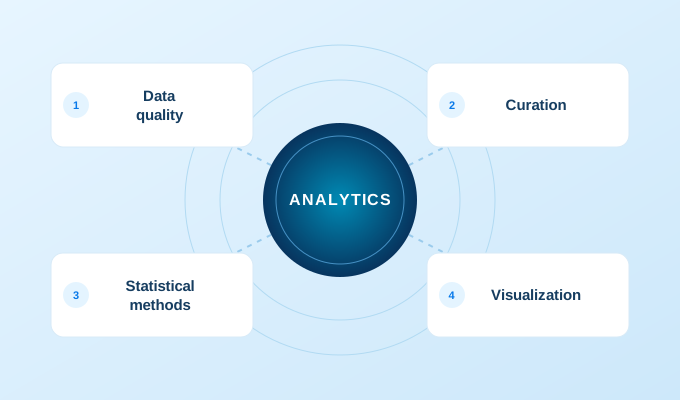
These connected elements help frame the work and the people it is intended to support.
Useful analytics depend on sound questions, well-understood data, transparent methods, and communication that makes limitations as clear as results.
Agree on the decision context, analytical question, and success criteria.
Profile data, resolve quality issues, and document transformations and terminology.
Apply suitable statistical methods and produce reproducible analytical outputs.
Present findings with context, assumptions, and limitations for the intended audience.
Activities are shaped around the mission, the available evidence, and the needs of the people doing the work.
Quality assessments, data dictionaries, analysis-ready datasets, reproducible code, and visual reports.
A useful analysis connects the original question to the data, methods, results, and limitations. Documentation and quality checks make those connections visible.
Examine completeness, consistency, formatting, and terminology. Record issues, decisions, and transformations rather than silently changing the source data.
Compare data definitions and formats across sources. Support mapping and harmonization using relevant standards and controlled terminology when appropriate to the work.
Develop documented analytical steps and present results as tables, listings, figures, or visual summaries. Include assumptions and caveats needed for sound interpretation.
A reviewer-facing analysis could start with a defined safety question, profile available datasets, document preparation steps, and produce tables and visualizations for scientific review.